One question posed by some people is, “what’s the big deal about a few degrees? That doesn’t seem like that much”.
There are several reason for serious concern over “just a few degrees of warming”:
- small changes in average climate can dramatically increase the likelihood and severity of extremes
- small changes in the global mean temperature are not distributed evenly around the globe and continental interiors and high latitudes tend to warm faster than the rest of the planet
- there is the potential that small changes in the global mean temperature could lead to destabilizing feedback mechanisms that could significantly further amplify a warming trend.
To illustrate the first point above, we can consider that anthropogenic warming impacts both the mean and variability of extreme events and that all geophysical phenomena can be thought of in distributional terms. This impact is illustrated in the figure below, with regard to heat extremes – although similar changes to the distribution of precipitation or drought events may lead to similar behavior.
source: IPCC
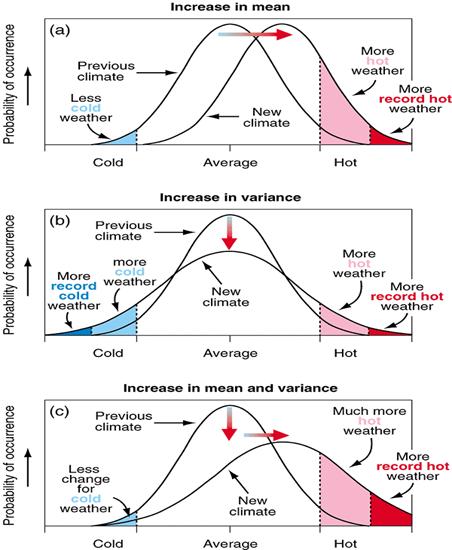
We know that for a given level of planetary warming, the warming of the Arctic will be much faster than the global mean. This can have a powerful destabilizing effect on ice sheets and contribute to rapid sea level rise. We also know that all geophysical variables (temperature, rainfall, sea level, winds) can be thought of as having a statistical distribution. A small shift in the average of the distribution has a disproportionate impact on the frequency and severity of the extremes. This concept is developed further in the more technical discussion on extremes.
There is also strong paleoclimatic evidence to believe that “relatively small” changes in the Earth’s mean temperature have been responsible for profound changes in the global climate in the past. One of the recent examples in geological terms is the Last Glacial Maximum – which happened about 20,000 years ago. There is compelling evidence that at this time, glaciers covered much of Europe and much of North America and in fact that Long Island and Cape Cod were terminal moraines of the LGM and that much of New York City and its surroundings were under thousands of feet of ice. There is also compelling evidence that global mean temperatures around this time were “only” 6C (or about 11F) colder than during the pre-Industrial period (source: https://news.ucar.edu/132755/scientists-nail-down-average-temperature-last-ice-age). Because so much more of the world’s water was frozen in glacial ice at that time, global sea levels were estimated to be over 100m or around 400 feet lower than today! Even if all the world’s glaciers were to melt, the total sea level rise would be less than 100m. And in all likelihood, we would need to get to really extreme levels of warming before making a significant dent in the East Antarctic Ice Sheet. An approximate map of the world’s ice sheets during the LGM and expanded continents (from lowered sea levels) is shown below – keep in mind, this was a version of our planet with global mean temperatures only 6C or 11F below the pre-industrial level.
source: https://www.visualcapitalist.com/wp-content/uploads/2023/05/CP_LastIce-Age_ClickOut.html

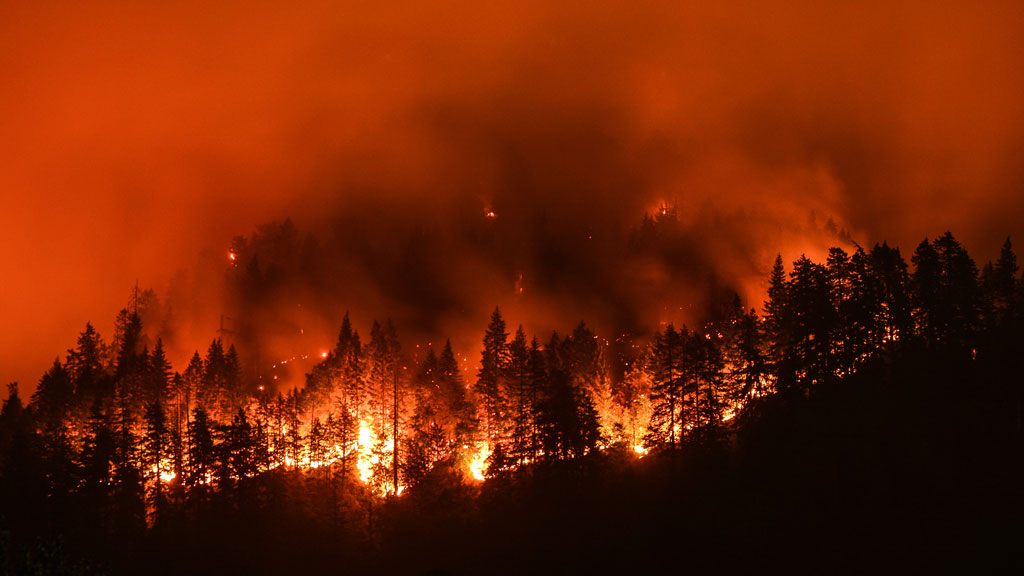
One of the clearest findings about extremes is the enhanced likelihood of extreme heat waves. This has clearly been documented in recent years in many places around the world – a particularly powerful example being the extreme Pacific NW “heat dome” that developed in the summer of 2021 that led temperatures in the US states of Washington, Oregon, Idaho and northern California to reach extreme levels, accompanied by extreme and widespread wildfires. This also spread northward to the Canadian province of British Columbia, where the all-time record high temperature for the country was not just broken, but was completely shattered – by almost 5C or 8F…prior to 2021, the highest temperature recorded in Canada was 113F or 45C. But during the exceptional heat wave of 2021, one town in British Columbia that was also engulfed in forest fires reached an extraordinary 121F or 49.5C. Only a handful of US states, and a few dozen much more tropical countries have ever seen temperatures exceeding that level. This level of heat wave would have been virtually impossible without the impact of climate change. Other recent years, including this year (2023) have also been marked by devastating wildfires in Canada and the western US.
source: Canadian Press – wildfire in British Columbia 2023
Furthermore, all of the Earth’s hottest 10 years have been since 2010, as shown by the graph and map animation below from NASA.
source: NASA
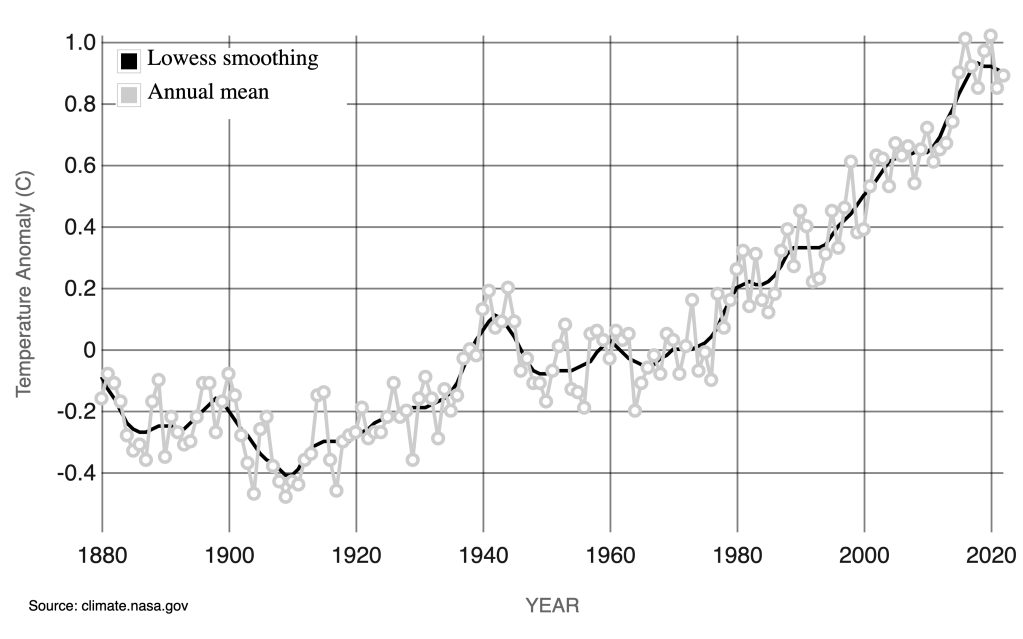
NASA global temperature time series and anomaly map
Another critically important impact of climate change – beyond the potential for extreme sea level rise, coastal inundation and severe heat stress is the increased intensity of both droughts and floods. This feedback on the hydroclimate cycle is a function of both atmospheric dynamics and the fundamental properties of water. As is explained in the Clausius Clapeyron page, the saturation vapor pressure of water is highly temperature dependent and for each degree C increase in mean ambient temperature, the atmosphere can hold about 5-7% more water vapor and maintain the same aggregate relative humidity. This adjusted equilibrium is reached quite quickly with an increase in temperature because a warmer atmosphere naturally evaporates more water from the surface ocean. More water vapor held in the air provides the potential for more severe storms when it does rain or snow. This tendency is particularly frightening in the context of tropical cyclones/hurricanes which have becoming more powerful over time and have shown a troubling shift towards “rapid intensification”. At the time of writing this segment, hurricane Otis has just struck western Mexico as a category 5 hurricane when a day before, it was a tropical storm and was only forecast to remain a tropical storm.
But because warmer air needs to reach a higher concentration of moisture to elicit precipitation, dry spells and droughts may become more prolonged in a warmer climate. In many regions (particularly semi-arid and arid climates), there is also a very strong interconnection between drought and heat – with hot conditions rapidly depleting soil moisture and dry soil conditions stimulating the rapid increase in air temperature because little of the thermal energy is going to latent heat exchange.
This “hydrological intensification” is also partly a product of other features of atmospheric dynamics. Warmer surfaces can induce more rapid upwelling convective motion (stimulating powerful storms) and can stimulate a stronger or broader downwelling atmospheric subsidence (associated with dry conditions) to compensate in mass balance. Furthermore, there seems to be some evidence that a warmer climate is more prone to prolonged patterns of blocking high pressure systems, more waviness in the jet stream and some sharper temperature contrasts along frontal boundaries – dynamical features that can all amplify the effects mentioned.
Some examples of hydroclimate extremes are shown below in images of both drought and hurricanes.
source: World Meteorological Organization https://public.wmo.int/en/media/news-from-members/human-influence-east-africa-drought

Satellite image of Hurricane Otis striking western Mexico at Acapulco in October 2023. Otis underwent extremely rapid intensification with peak wind speeds increasing by more than 100 mph in 24 hours.
source: https://www.cnn.com/2023/10/24/weather/hurricane-otis-acapulco-mexico/index.htm

source: US Congressional Budget Office report on hurricane damages https://www.cbo.gov/publication/55019

Winter Extremes
Myths: Sometimes people who experience winter weather that is colder or snowier than normal ask how that experience can be consistent with a narrative of climate change and global warming. While it is a human tendency to “globalize” one’s own personal experience and while a healthy amount of skepticism is important for educated citizens and scientists alike, this line of questioning is based on fallacious logic.
The Earth’s surface area is over 500 million sq km or around 200 million sq miles. Only 30% of the Earth’s surface area is land, with the rest being ocean. Even though the US is a large country, it constitutes less than 10 million sq km or only about 2% of the world’s surface area or about 1/15th the total land area. For example, in the winters of 2013 and 2014, the eastern 2/3 of the US and Canada were very cold relative to the long term mean. In the same winters, the western parts of the US and Canada were very warm. But clearly, even though the cold anomaly over eastern and central North America was quite pronounced, if the average temperature over the rest of the world (the other 96-97%) was even slightly warmer than the long term mean, that effect would be dominant and the global mean would still be warmer than average.
Furthermore, climate change does not mean that the global mean temperature is rising every single year. There is still variability from year to year because of the physics of the coupled ocean-atmosphere system. The hottest year on record was 2016 (although this may be eclipsed by 2023) – partly because of climate change and partly because of the extreme El Nino pattern in the global tropics – which tends to increase global mean temperatures. In 2020, 2021 and 2022, the tropics have been dominated by a “La Nina” pattern which tends to cool the global mean temperature – and yet, 2020, 2021 and 2022 all are among the top 7 warmest years. Longer term analysis shows a clear positive trend, despite this inter-annual variability with the average temperature in the last decade being more than 1 degree C or around 2F warmer than the pre-industrial mean temperature.
This type of questioning sometimes happens on the national or international stage in a stupidly performative fashion (like US Senator James Inhofe bringing a snowball into Congress in February of 2016 to “disprove” climate change – when some amount of snowfall in February in Washington DC is normal). There’s been some research on this phenomenon of political conservatives waivering in their acceptance of the premise of climate change depending on their own personal experience of winter weather.
But in this post, I also want to address how climate change can actually, in some instances, enhance the likelihood of two types of winter phenomenon: cold air outbreaks in the mid-latitudes and heavy individual snowfall events, particularly with lake effect or ocean effect amplification. Understanding the science should take precedence over answering to opinion.
Mid-latitude cold air outbreaks: While in general, winters across the mid and high latitudes have been getting warmer over time, there have been occasional bouts of exceptionally cold and/or snowy weather in mid-latitude regions – the US, Canada, Europe, parts of Asia, etc.. For reasons explained in the energy balance section, the global oceans and atmosphere act in total to export heat from low latitudes to high latitudes and in a warmer climate, this effect is more pronounced, generally resulting in faster warming rates in high latitudes. This decreases the equator to pole temperature difference. This gradient of temperature with latitude plays a critical role in the strength of the sub-polar jet stream through a concept known as the thermal wind relation. The sub-polar jet stream in both hemispheres acts as a sort of atmospheric barrier between colder air closer to the poles and warmer air closer to the equator.
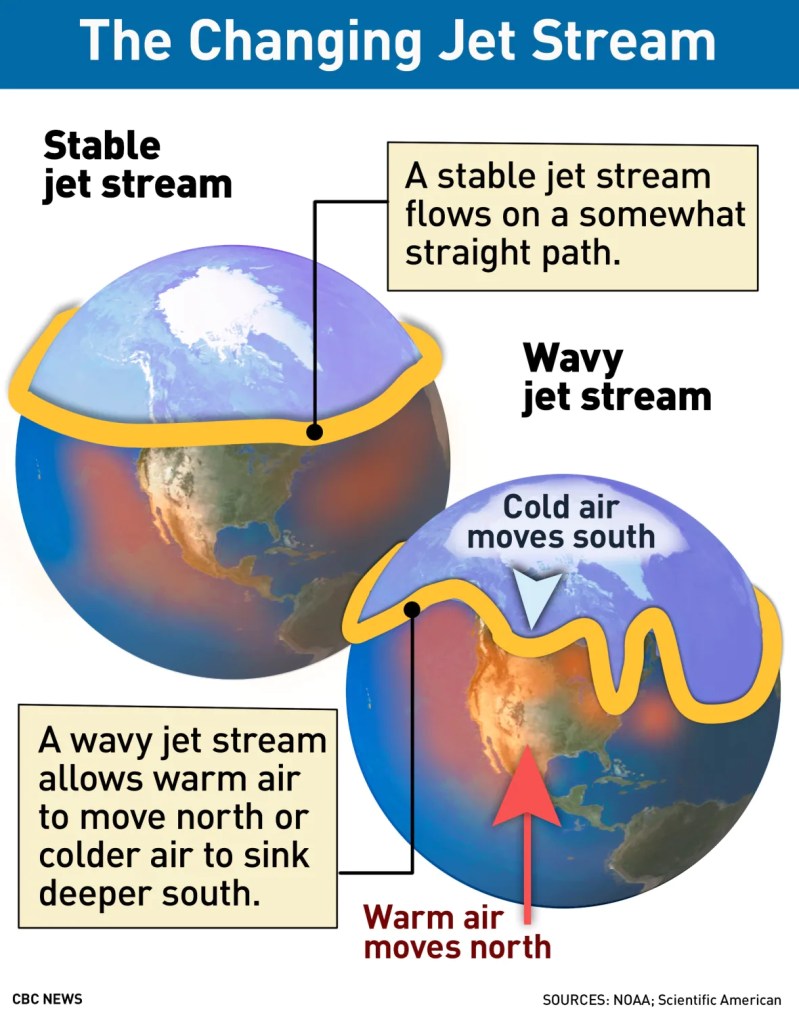
Basically, the stronger the temperature gradient is as a function of latitude, the stronger the zonal (west-east) component of the jet stream is. As the temperature gradient weakens, so too does the zonal component of the jet stream. This may allow anomalous pockets of cold air from the Arctic (in the northern hemisphere) and Antarctic (in the southern hemisphere) to occasionally move closer to the equator than would be the case with a stronger zonal jet stream. So despite a backdrop of generally warming temperatures, many locations may see occasional very cold weather. This is illustrated by the diagram below.
source: https://www.cbc.ca/radio/quirks/new-computer-model-explains-faltering-jet-stream-1.5157825
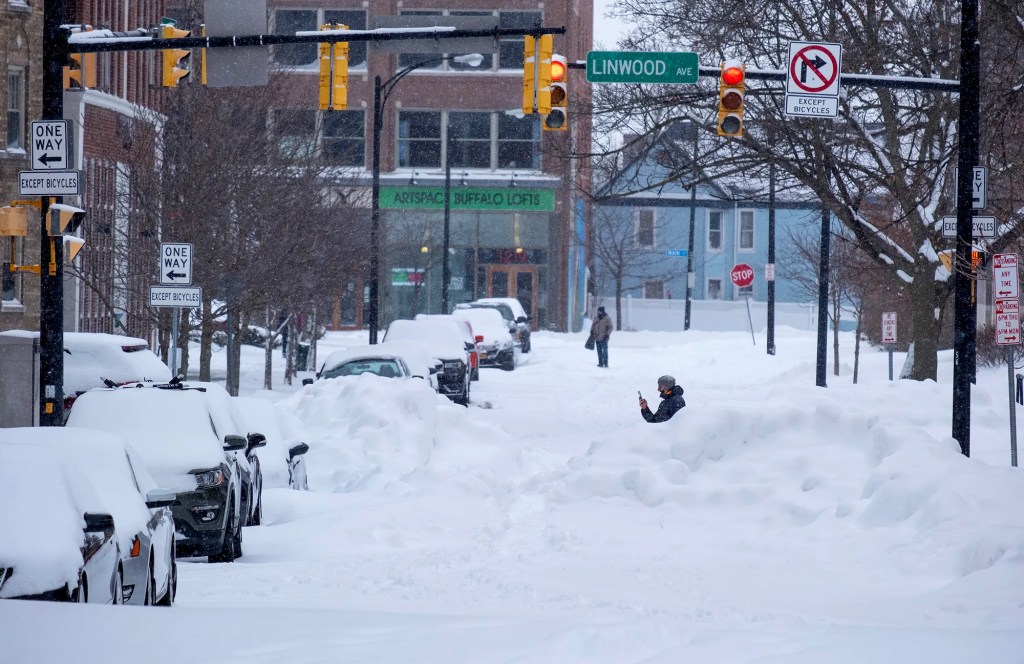
In the winter of 2022-2023 in the US, in late December there was an Arctic blast and severe lake effect snowfall event that buried western New York around Buffalo in 6 feet of snow and sadly killed a number of people. In early February, another major cold air outbreak accompanied by very strong winds led to the coldest ever wind chill reading in the US on the summit of Mount Washington, NH at -110F (air temperature -42F and over 100mph winds). However, if one looks at the overall temperatures and snowfall rates across much of the US this winter (including in the Northeast), the average statistics are much warmer and less snowy than normal. And actually, in much of the Northeastern US, the winter of 2022-2023 was the warmest on record and one of the least snowy.
Heavy snowfall events (particularly with lake or ocean effects): Clearly, the ambient air temperature needs to be below freezing from the surface up to the clouds in order for snow to fall – by definition. Otherwise the precipitation would fall as sleet, freezing rain or rain. But because of the strong temperature dependence of water vapor capacity in the atmosphere, the conditions that can usually generate the most snowfall are those where the ambient temperature is very close to freezing. Furthermore, warmer water evaporates more easily and in greater abundance. Major winter storms often draw considerable moisture from oceans and lakes that are unfrozen. This process is known as the ocean effect or lake effect and is responsible for many large snowfall events in the Great Lakes and some of the larger “Noreaster” style storms in the mid-Atlantic and New England. The warmer those water bodies are, the more water vapor will be evaporated from them and entrained into the storm system that may then generate heavy snowfall.
New York City experienced a near record snowfall in February 2006 after near record January warmth that year. Boston has had some exceptional snowfall in 2012 and 2005 for similar reasons. Some recent winters in the Great Lakes have produced monster lake-effect snowstorms in lake effect areas near Buffalo, NY (2022) and Erie, PA (2018). As the climate warms, in general, the rain/snow line shifts further north and most regions experience a greater share of their winter precipitation in the form of rain or ice. The US Great Lakes will also have progressively less ice cover in warmer winters – so the potential for evaporating moisture from the lakes into storm systems increases. For more information, consult https://yaleclimateconnections.org/2022/12/how-climate-change-influences-lake-effect-snow.
source: https://nypost.com/2022/12/27/buffalo-snow-storm-photos-2022-pictures-of-deadly-ny-blizzard/#2
Consequently, in certain regions, conditions for individual monster snow storms may become more frequent, even against a backdrop of a general reduction in overall snowfall across the planet.
