Seasonality
The most fundamental form of climate variability is the annual cycle of the seasons. The seasons occur the way they do because of the tilt of the Earth on its rotational axis and the nature of the Earth’s orbit around the Sun. The Earth’s orbit around the Sun is almost perfectly circular, but the Earth is tilted 23.5 degrees on it’s rotational axis. This combination of factors means that the tilt of the Earth’s orbit plays a much bigger role in determining the seasons than the planet’s proximity to the Sun. On other planets with less of a tilt and/or a more elliptical orbit around the star, the proximity to the star plays the larger role. The diagrams below show the position of the earth at the solstices, equinoxes, aphelion (furthest point from the Sun) and perihelion (point of closest approach to the Sun).
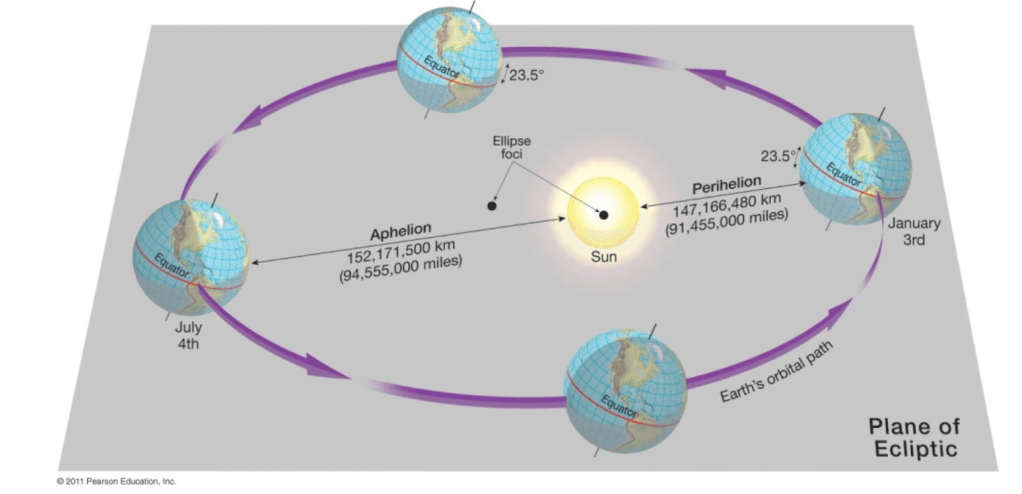
As is illustrated above the perihelion occurs close to the northern hemisphere winter solstice (January 3rd vs. December 21st) and the aphelion occurs close to the northern hemisphere summer solstice (July 4th vs. June 21st).
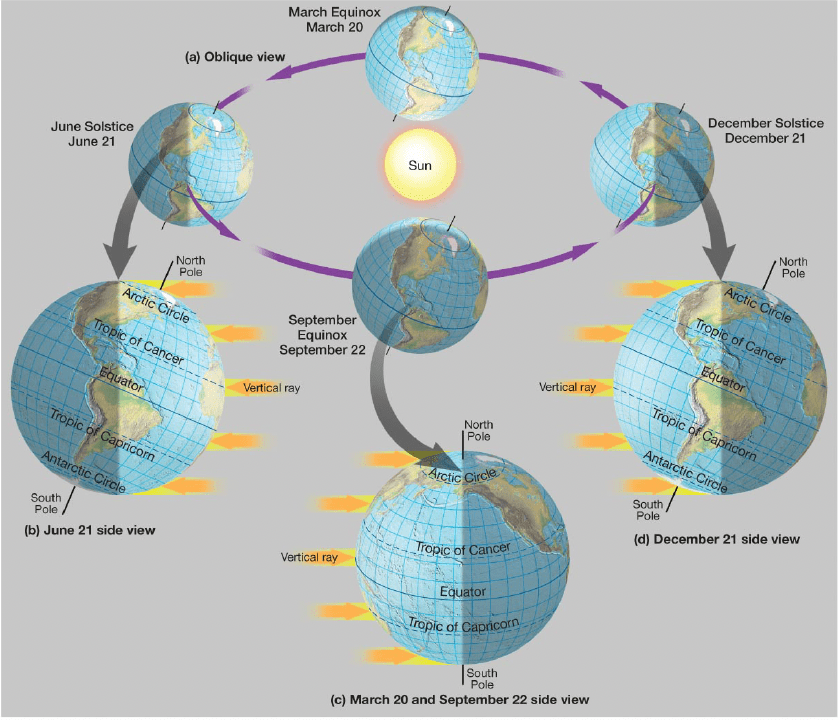
On December 21st, the Sun’s rays shine more directly on the southern Hemisphere and the “effective equator” is the Tropic of Capricorn at 23.5 degrees S – hence this is the height of southern Hemisphere summer. On June 21st, the Sun’s direct rays shine more directly on the northern Hemisphere and the “effective equator” is the Tropic of Cancer at 23.5 degrees N – hence this is the height of northern Hemisphere summer.
In truth, the peak temperatures in each hemisphere typically occur about a month after the summer solstice (July in the NH and January in the SH) and coldest temperatures typically occur about a month after the winter solstice (January in the NH and July in the SH). This is because both heating and cooling are not an instantaneous function of radiation but also a function of the heat capacity of air and the “memory” in the system. Water temperature maxima and minima tend to be even more delayed because water has a much higher heat capacity than air – so northern hemisphere sea temperatures typically peak in late August or early September and reach their coldest levels around late February/early March. The reverse is true for the southern hemisphere.
Because of the effect of the tilt of the Earth’s axis, there are considerably larger changes in solar intensity over the course of the year at high latitudes than at low latitudes. This tends to translate to a much larger annual range of temperatures at high latitudes than at low latitudes. The intensity of solar radiation is a function of the cosine of latitude. While atmospheric movements distribute heat from areas of high solar heating to areas of low solar heating, the direct incident radiation has a significant impact on the observed temperature.
Consider the following cities in the Northern Hemisphere: Niamey, Niger (latitude 13N), New York, US (latitude 41N) and Yakutsk, Russia (latitude 62N). At noon on June 21st, the “effective latitude” of Niamey is 13N-23.5 = 10.5S, whereas for New York, it is 41N-23.5 = 17.5N, and for Yakutsk, it is 62N-23.5 = 45.5N. At noon on December 21st, the “effective latitude” of Niamey is 13N+23.5 = 36.5N, whereas for New York, it is 41N+23.5 = 64.5N, and for Yakutsk, it is 62N+23.5 = 85.5N.
Average summer high temperatures in Niamey are in the mid-90s F or about 35C and winter low temperatures are around 60F or 15 C. The hottest time of year is actually in April May – when daytime high temps typically reach over 40C or the mid to upper 100s F.
In New York, an average summertime high temperature is in the mid-80s F or around 30C and the average nightime lows in winter are in the low 20s F or around -5C. In Yakutsk, which is one of the coldest cities in the world, the summer time high temperatures average in the upper 70s F or around 25C (and there have been temperatures as high as 100F recorded there), but the average winter time lows are in the -50s F or around -45 C. The record coldest temperature in Yakutsk was -64 C or -84 F.
In addition to having an important control on the intra-annual variation of temperature, the pattern of seasonality also has a significant impact on the pattern of wet and dry cycles – particularly in the tropics. The seasonality of rainfall in the subtropics, mid-latitudes and high latitudes is heavily influenced by large scale frontal systems, blocking high pressure systems and deviations in the jet stream which are covered in more depth in other sections of this website.
But in the deep tropics, there is a seasonal zone of intense precipitation known as the intertropical convergence zone or ITCZ – which is where localized heating causes air to rise, moisture to reach it’s condensation level and to rain heavily. Surface flow both to the north and south of the ITCZ “converges” towards the ITCZ, but the seasonal position is dictated by the seasonality of the Sun’s direct rays. The ITCZ is in its most northern position at the height of northern hemisphere summer and in its most southern position at the height of southern hemisphere summer and is near the equator in the seasons closer to the equinoxes. As a result, for many arid, semi-arid and seasonal climates in the tropics that are very close to the equator (within about 10 degrees of the equator), there is a “bimodal” precipitation pattern with two peak rainy seasons and two dry seasons. In contrast, regions further from the equator (10-25 degrees away from the equator) tend to have a unimodal rainy season with one wet season when the ITCZ is in one hemisphere or another and a dry season when the ITCZ is in the other hemisphere.
Climatology
The “climatology” of a region refers to its long-term aggregated statistics of temperature, rainfall, snowfall, windiness, etc.. This is always seasonally dependent, but is also changing as the climate itself changes. As has been discussed on this page and others, latitude has a very significant effect on overall temperature climatology, with lower latitudes generally being warmer than higher latitudes. Other factors, such as those discussed on the regional climate page (elevation, positioning with respect to mountains, prevailing winds, and position in continental interiors or near the coast) also have an important effect on overall temperature and precipitation. Precipitation’s variability with latitude and season is more complex – there are comparatively dry areas in the subtropics and the poles, a mixture of climates and seasonalities in the mid-latitudes and a zone of heavy rainfall in the deep tropics.
Surface Air Temperature Over Land
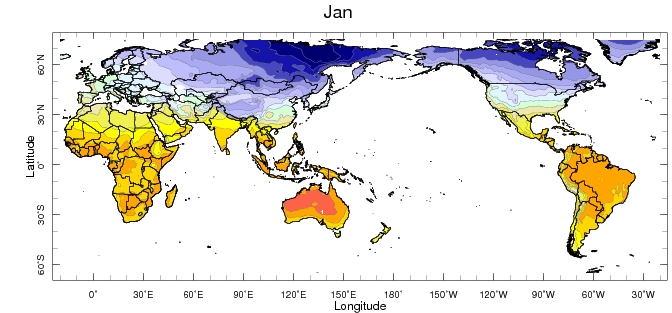
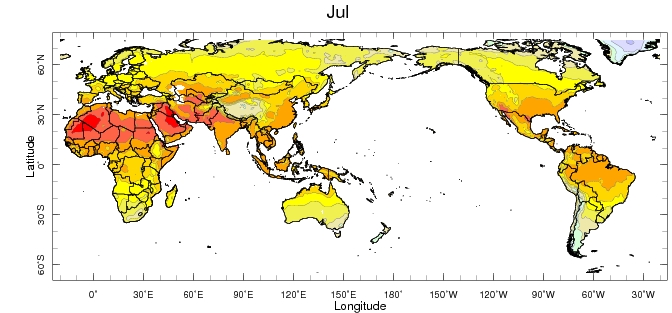
Here are the 1991-2020 global 2 meter air temperature climatologies (over land) for January and July respectively from the University of East Anglia Climatic Research Unit Dataset.
Source: UEA CRU (http://iridl.ldeo.columbia.edu/SOURCES/.UEA/.CRU/.TS4p05/)

Below is the animation by month
Monthly surface air temperature over land
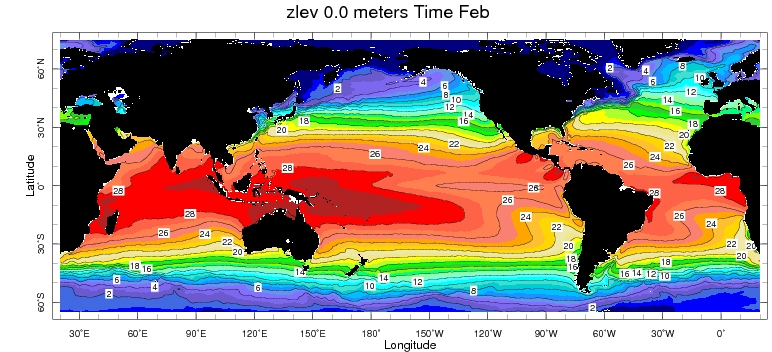
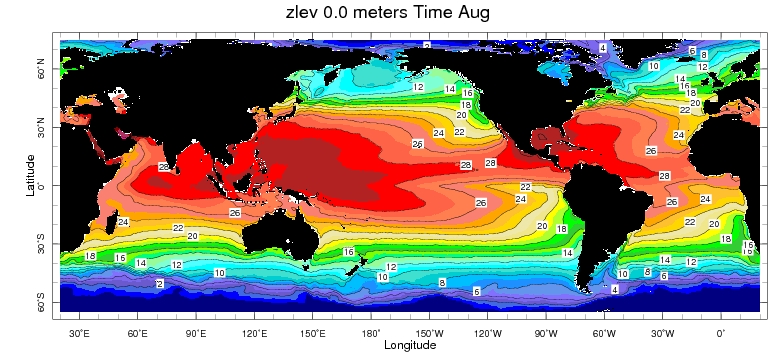
Sea Surface Temperature
Here is the 1991-2020 global sea surface temperature for February and August, respectively, from the NOAA National Climatic Data Center (NCDC) AVHRR Optimum Interpolation SST (OISST) dataset.
Source: AVHRR OISST https://iridl.ldeo.columbia.edu/SOURCES/.NOAA/.NCDC/.OISST/.version2p1/.AVHRR_monthly/.sst_c9120/

Below is the animation by month
Precipitation
Here is the 1991-2020 global annual precipitation from the NOAA Climate Prediction Center’s CAMS-OPI merged satellite station dataset.
Source: CAMS-OPI: http://iridl.ldeo.columbia.edu/SOURCES/.NOAA/.NCEP/.CPC/.CAMS_OPI/.v0208/.dataset_documentation.html
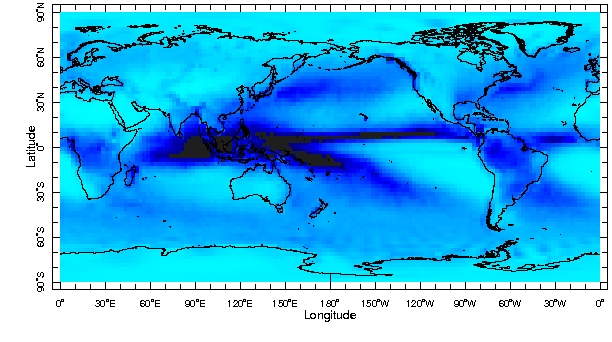

precipitation/year (mm)
The areas in black in the western and tropical Pacific Ocean Basin and in the eastern Indian Ocean basin receive more than 3000 mm of rainfall (120″) per year. There are individual locations on small islands or on continents with steep topography in very humid environments that receive even more, but in making this graphic, I chose to show the range 0-3000 mm, so that I could display adequate granularity for the majority of the world that receives rainfall amounts in this range.
Below is the animation by month.
Major Cities Climatology
The world is tending towards urbanization and many of the world’s major urban areas are experiencing climate stresses alongside challenges of migration, infrastructure maintenance, health, energy, housing, etc..
This page shows a number of color-coded global maps of major cities around the world. The 20 most populous metro regions in North America, South America, Europe and Africa are included. The smallest of these metro regions in these four continents have about 2.5 million inhabitants. Because Asia has such a high population and so many major cities, 37 metro regions from Asia are included – but even the 37th most populous metro region in Asia still has about 7 million inhabitants. Because Oceania has such a small population by comparison, I’ve included the 7 metro regions in Oceania that have more than 1 million inhabitants. These maps were made in Python.
Population (millions)
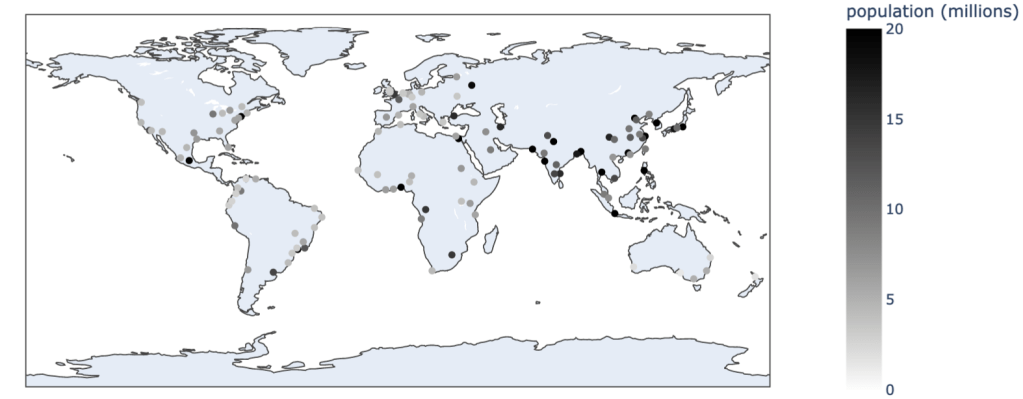
There are 17 metro regions with populations over 20 million (all shaded in dark grey here, but I’ve used the colorbar to span the range from 0 to 20 million to give more granularity for the smaller metro regions). The metro regions with more than 20 million inhabitants are as follows:
| City | Country | population (millions) |
| Guangzhou-Foshan (Canton) | China | 68 |
| Tokyo-Yokohama | Japan | 50 |
| Shanghai | China | 40 |
| Delhi-New Delhi | India | 33 |
| Jakarta | Indonesia | 29 |
| Manila | Philippines | 27 |
| Mumbai | India | 27 |
| Seoul | South Korea | 25 |
| Cairo | Egypt | 22 |
| Lagos | Nigeria | 21 |
| Dhaka | Bangladesh | 21 |
| Sao Paolo | Brazil | 21 |
| Beijing | China | 21 |
| Mexico City | Mexico | 21 |
| Bangkok | Thailand | 21 |
| Karachi | Pakistan | 20 |
| New York | USA | 20 |
Elevation (m)
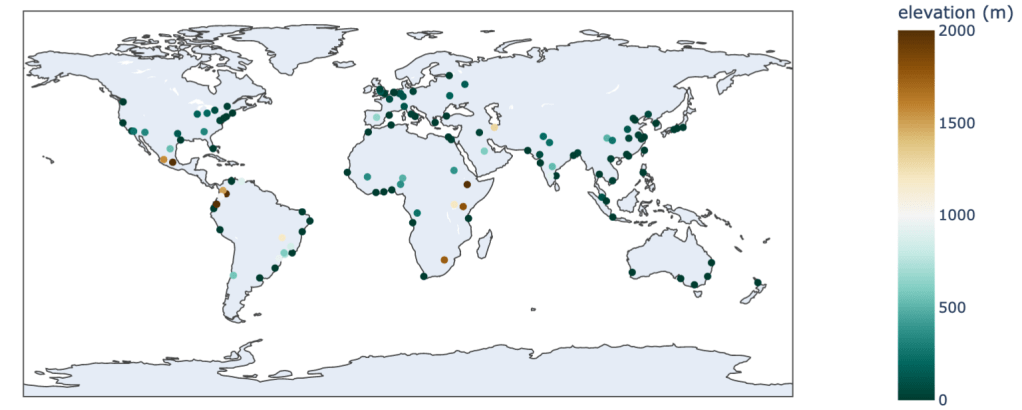
There are four major cities at a higher elevation than 2000 m – they are Mexico City; Bogota, Colombia; Addis Ababa, Ethiopia; and Quito, Ecuador.
Annual Average Precipitation (mm)
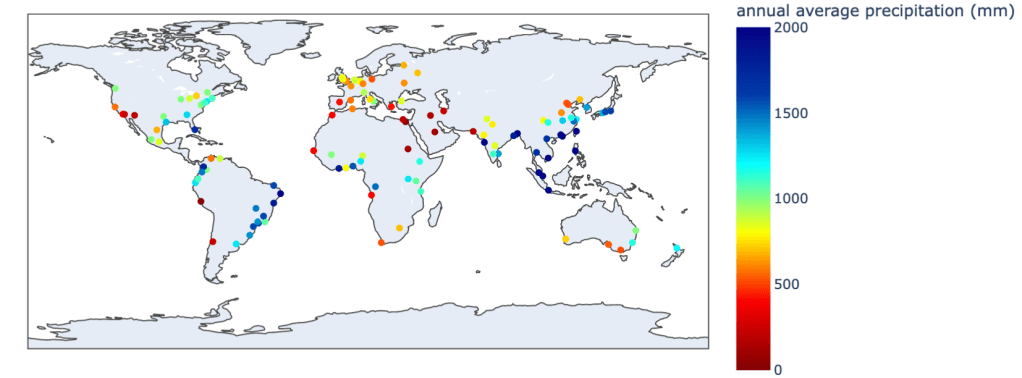
There are eight cities with average annual precipitation amounts in excess of 2000 mm. They are all colored in dark blue and are Recife, Brazil; Mumbai, India; Dhaka, Bangladesh; Singapore; Kuala Lumpur, Malaysia; Taipei, Taiwan; Hong Kong, China; and Manila, Philippines. Again, I’ve chosen to use the colorbar to span the range from 0-2000 mm to give more granularity to the cities in that range.
Average High Temperature at hottest time of year (C)
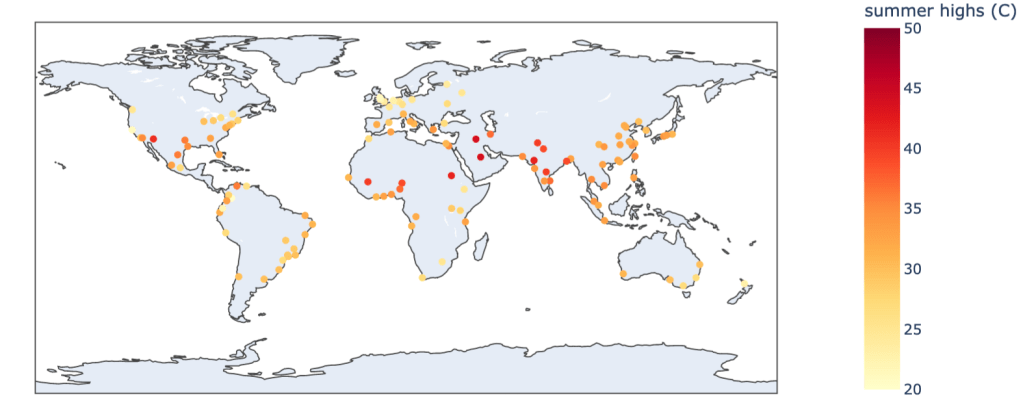
All the values shown here are between 20C/68F (Bogota, Colombia) and 44 C/111F (Riyadh, Saudi Arabia and Baghdad, Iraq).
Note that while for most cities in the northern hemisphere this is July/August and for most cities in the southern hemisphere this is January/February, there are a number of cities with strong monsoonal rainfall during the hemispheric summer (particularly in the northern hemisphere) which suppress the temperatures at that time of year, so the typical period of peak temperature is several months earlier (eg. April to early June). There are also cities in the “bimodal” precipitation regions that experience peak temperatures during the drier times of year.
Record High Temperature (C)
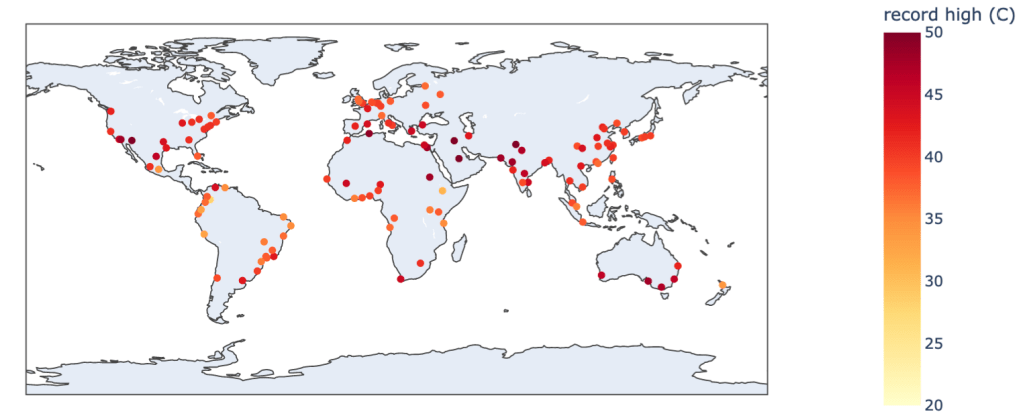
All values here are between 28C/82F (Bogota, Colombia) and 52C/126F (Baghdad, Iraq).
Average Low Temperature at coldest time of year (C)
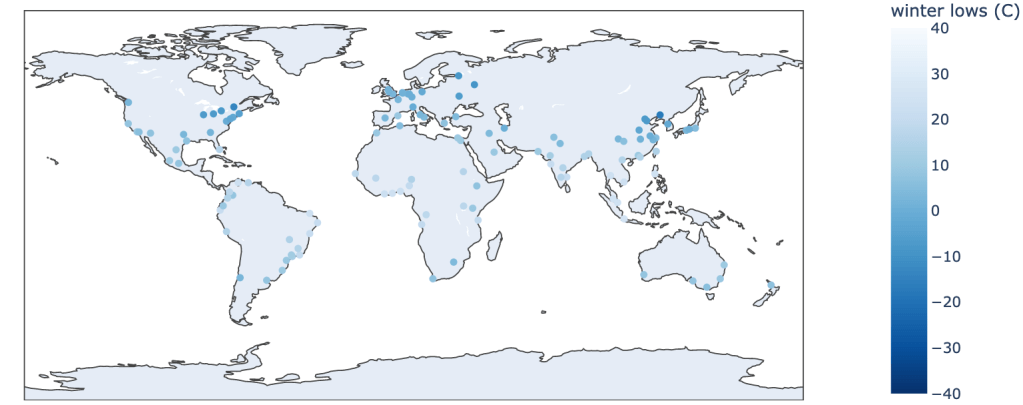
All values here are between 25C/77F (Jakarta, Indonesia) and -17C/2F (Shenyang, China). I used a blue scale from +40C to -40C to make sure that the warmer cities were discernible.
Record Low Temperature (C)
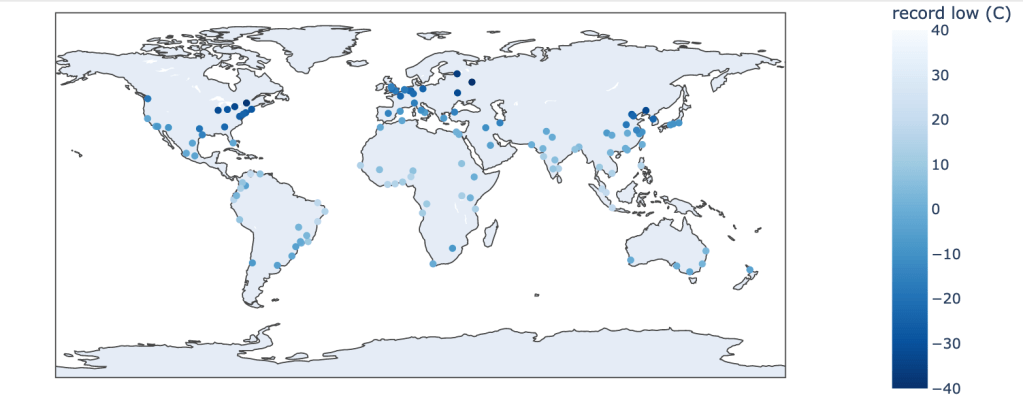
All values here are between 19C/66F (Singapore) and -42C/-44F (Moscow, Russia).
Across these 123 metro areas, population tends to be positively correlated with precipitation and summer high temperature (primarily because of the large number of very large cities in Asia in tropical, humid environments).
Elevation is significantly negatively correlated with both summertime average high and maximum recorded high and with latitude. The cooling effect on maximum temperatures is predictable because of the effects discussed on other pages. Because most of the major cities at high elevation are in the tropical Americas or in Africa, these high elevation cities don’t get as cold as some of the lower elevation cities at much higher latitude.
The absolute value of latitude is negatively correlated with precipitation, average summer high temperatures, average winter temperatures and extreme winter temperatures (i.e. cities further from the equator tend to be cooler at all times of year and drier). Interestingly, the absolute value of latitude is positively correlated with maximum recorded temperature: many subtropical and mid-latitude cities and even higher latitude inland cities have experienced very hot extreme weather, whereas many cities near the equator (and especially those also at high elevation) have moderating local factors that prevent the maximum temperature from going too high.
Precipitation (generally more abundant in the tropics) is positively correlated with winter average temperatures and record minimum temperatures (eg. colder places are drier) and is negatively correlated with maximum temperatures (wetter places don’t tend to experience the most extreme summer heat).
Summer temperatures are positively correlated with maximum temperature, winter temperature and minimum temperature. Winter average low temperatures are very highly correlated with all time record low temperatures.
